The below updates went live in our Production channel
To our USA Zone: Saturday, 10 April, between 12am & 1am Australian Eastern Standard Time (AEST)
To our Australian Zone: Wednesday 31 March, between 5pm & 6pm Australian Eastern Standard Time (AEST).
What is the focus of this release?
- New Cloud Console Interface - a completely new look and feel for the meldCX Cloud Console
- Notifications Centre - enable proactive support and setup notifications for when important events happen in your device network
- Policies - Define the rules about which devices and events to monitor
- Security Centre - Review and download an account audit of actions taken within the Console
- Integrations - Connect your other favourite software tools so they can work together
New features at a glance
Cloud Console user interface refresh
- The user interface has been re-imagined with a new bright, modern and clean design. All functionality remains unchanged, it just looks more awesome. Here are some screenshots of existing features:
-
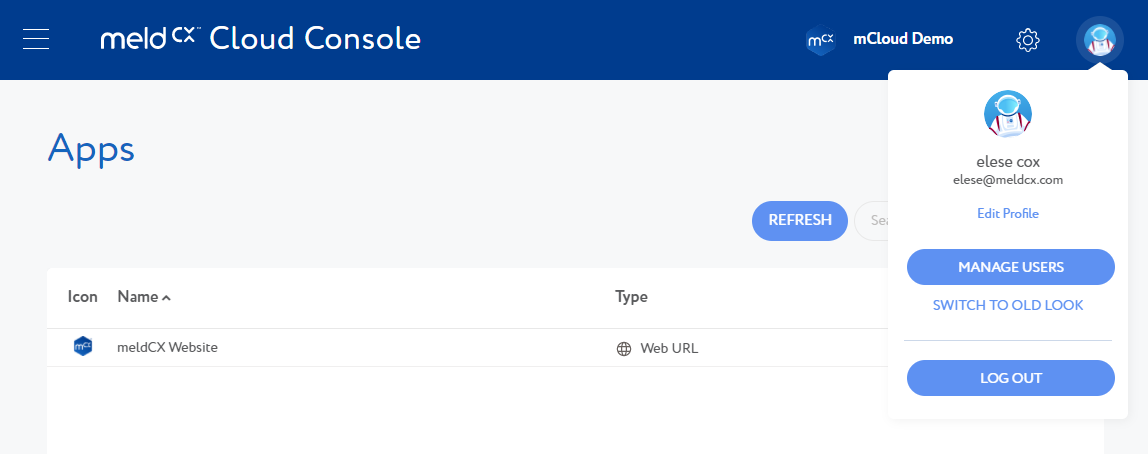
- Account management has changed locations:
-
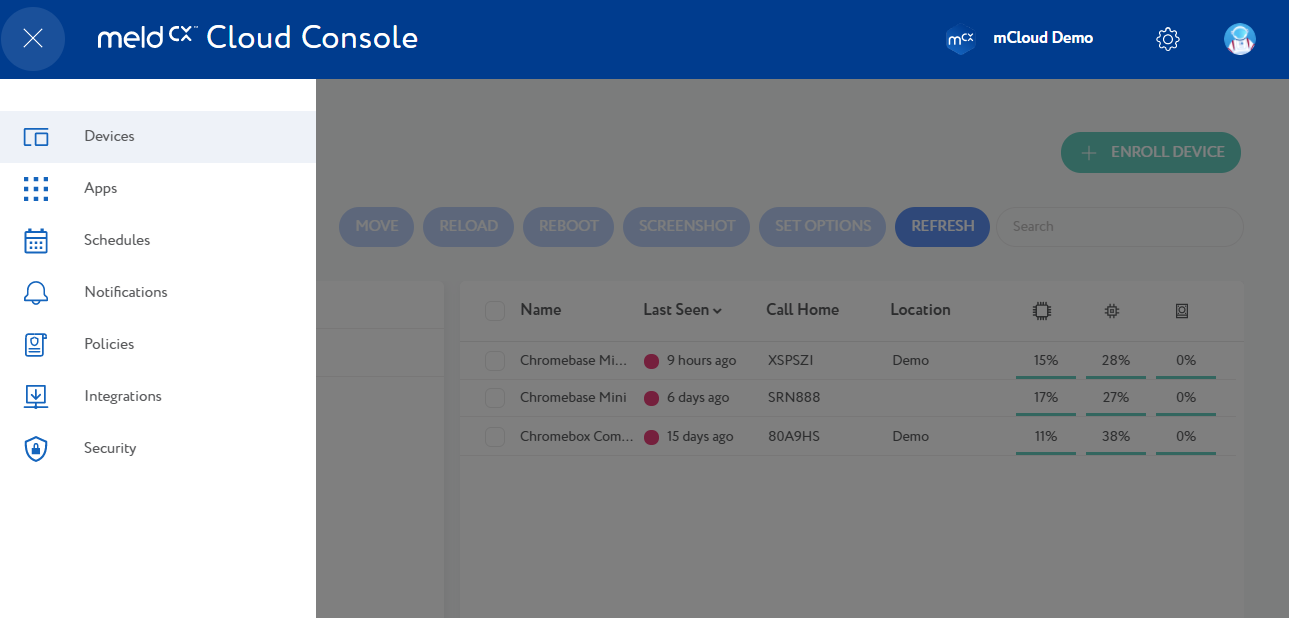
- Navigation is now behind a collapsable menu:
-
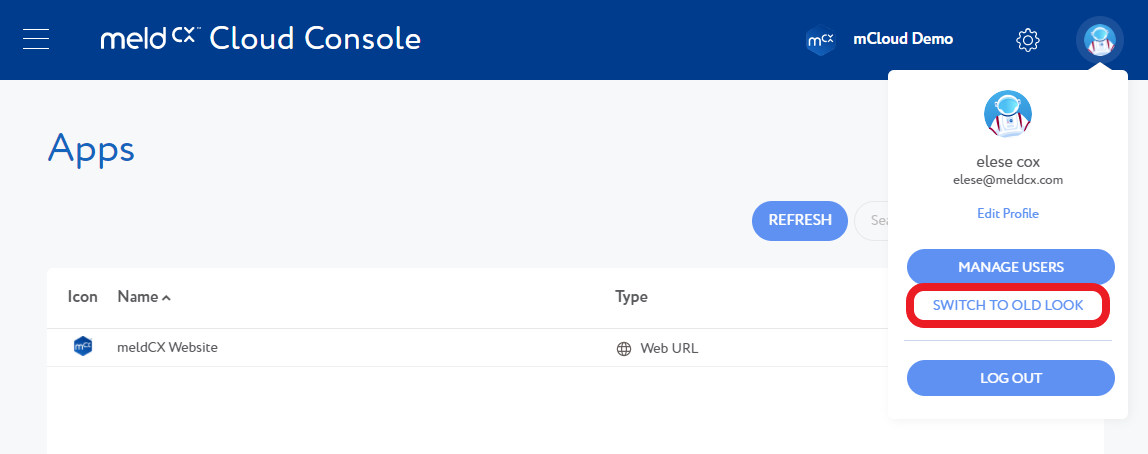
- Prefer the old theme? You can change back to the old theme here:
-
Notifications Centre
- You can find the Notifications Centre in the new navigation menu. Once you arrive, you will see a split between "Watching", and "Everything"
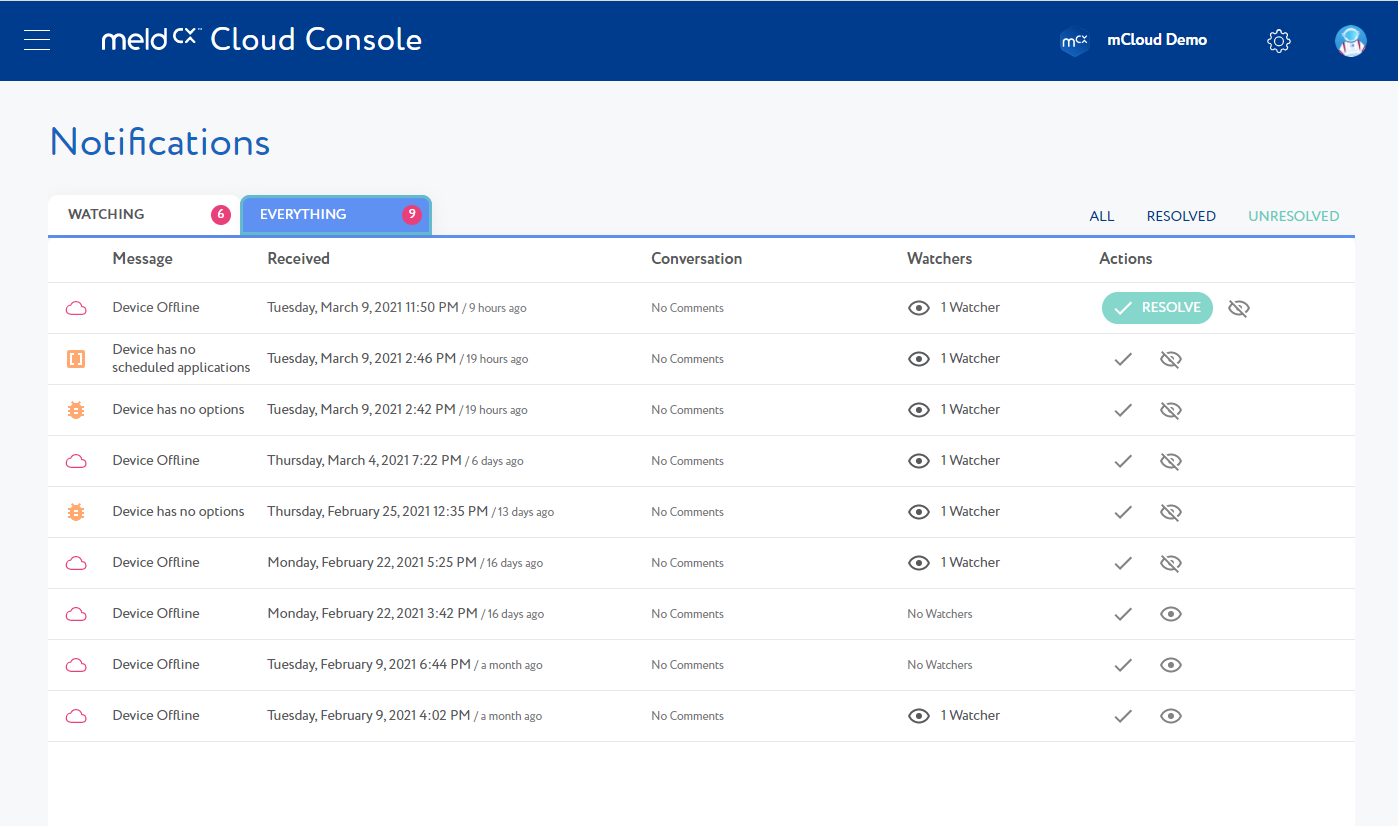
- Your account has a 'see all' view of all notifications which can be found under the "Everything" tab. This is where Administrators can monitor and review active notifications. This includes reviewing date and time of triggered notifications:
-
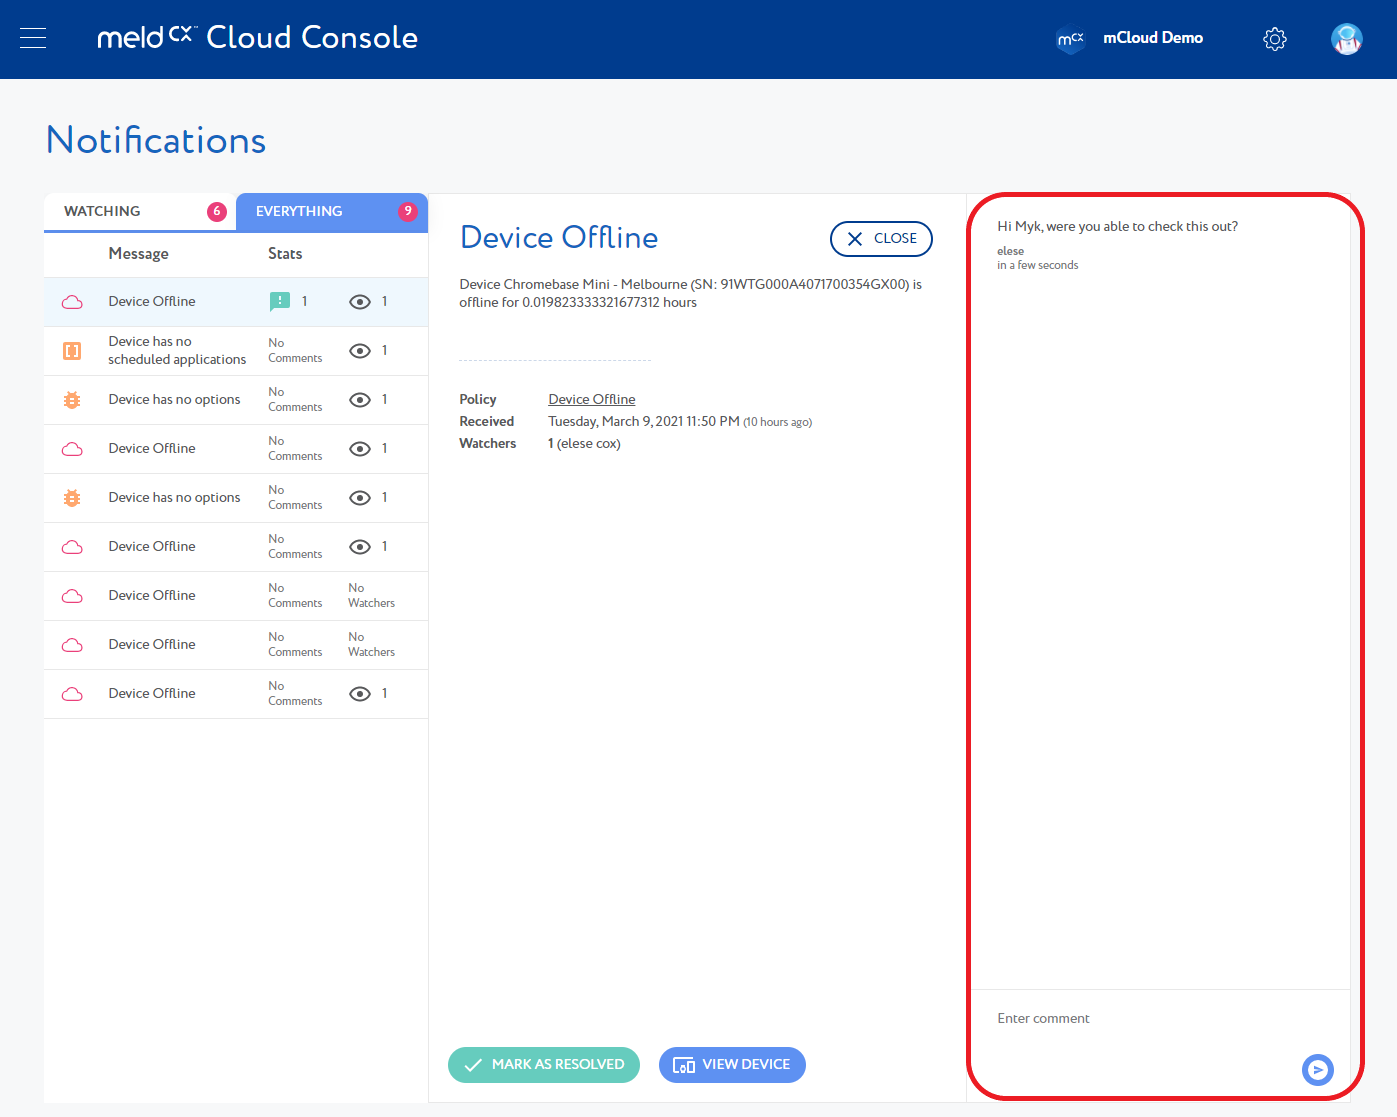
- Leave comments to collaborate with other users:
-
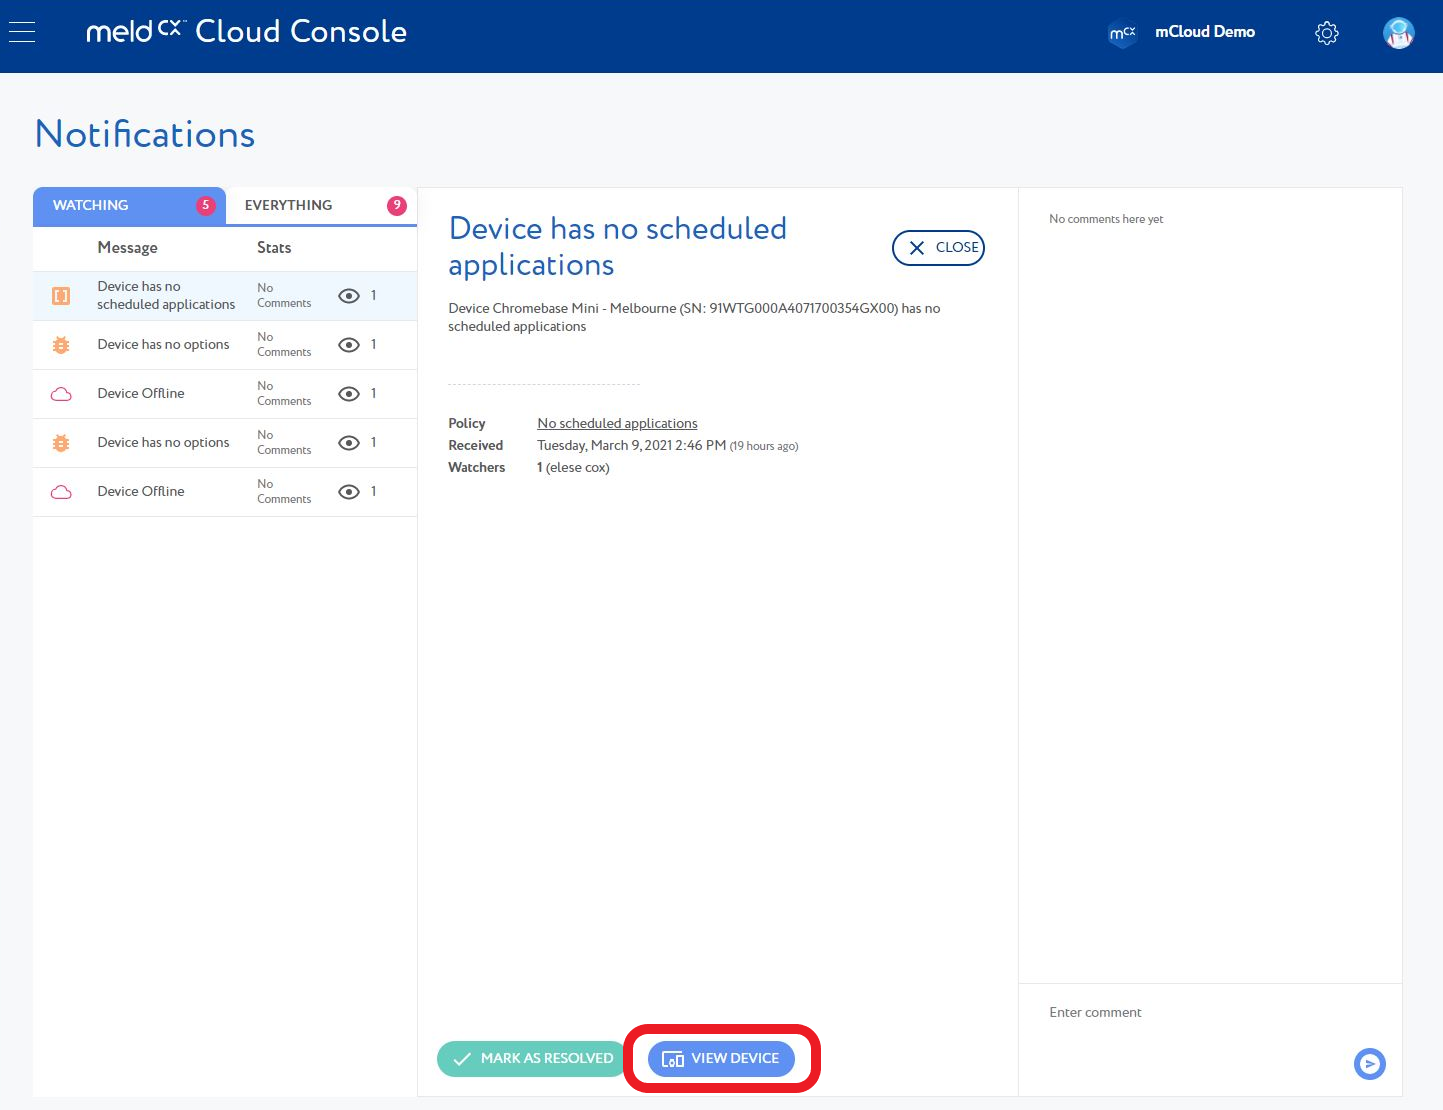
- Monitor notifications and navigate straight to the impacted device/s:
-
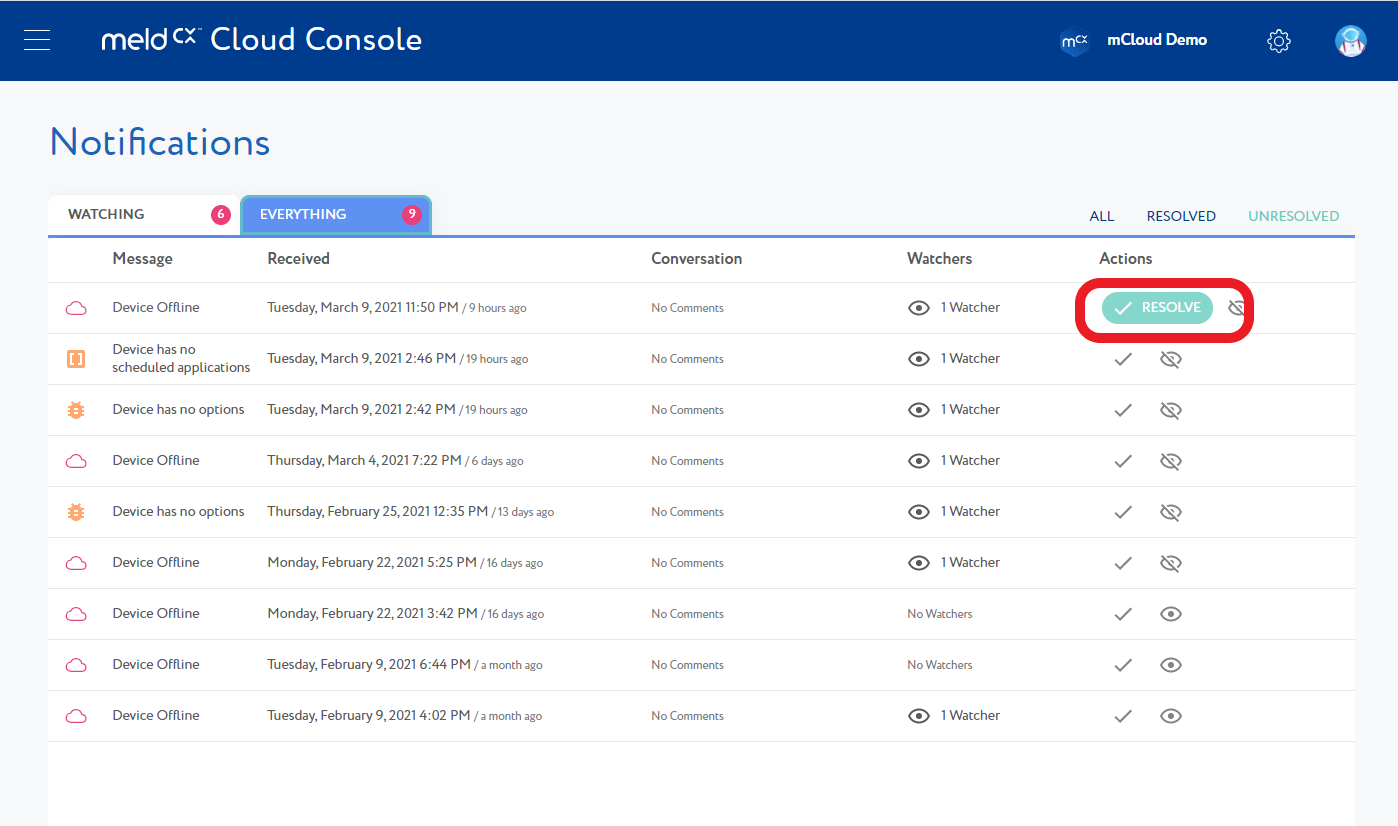
- Elect to resolve a notification:
-
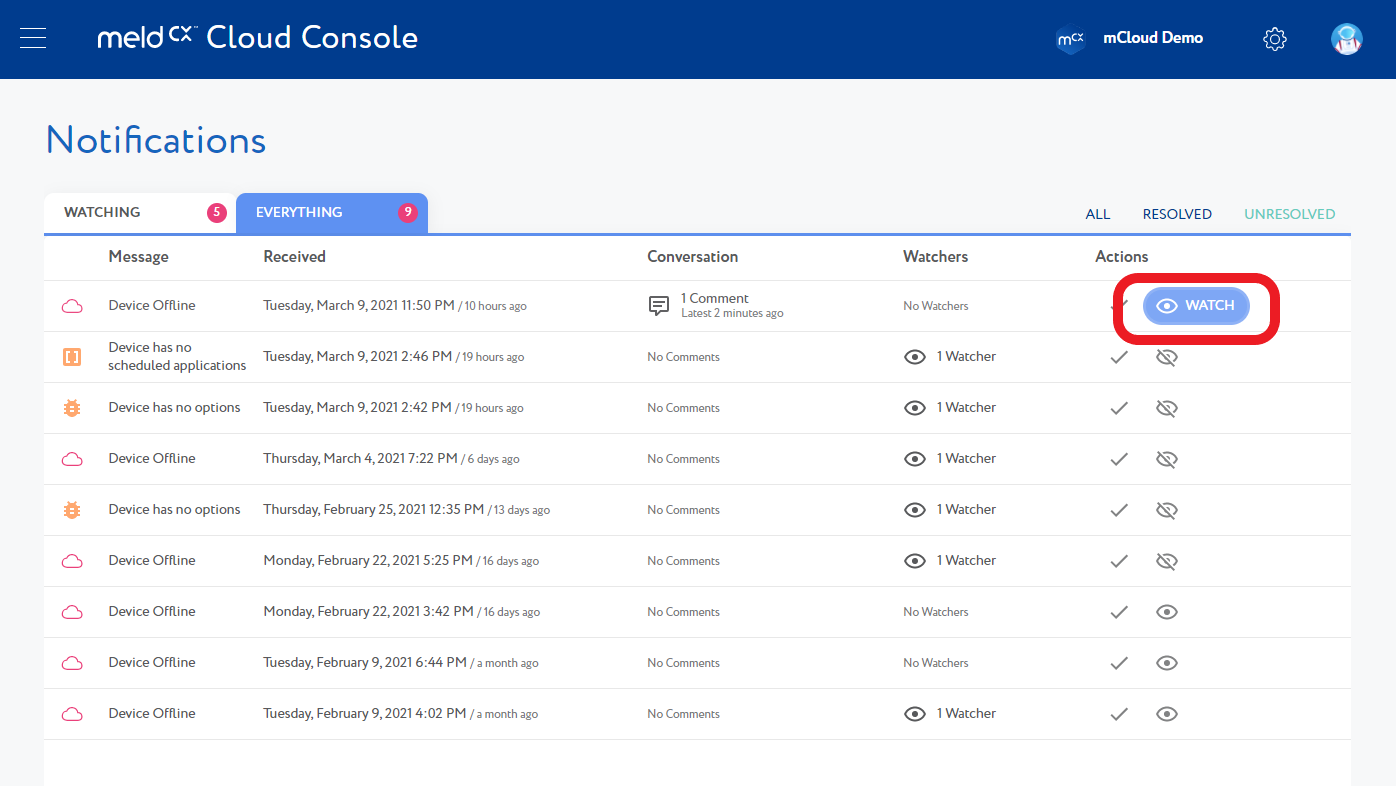
- Elect to 'watch' a notification (which filters that notification to the "Watching" tab:
-
Policies
A Policy prescribes the rules in which Notifications are created and sent.
It uses Triggers to determine when to create them, and Actions to determine how to communicate them.
- You can find the Policies section in the new navigation menu. Once you arrive, you will see a list of created policies (if you have any!), as well as an "Add New Policy" button
- In the created policies list, Administrators can review and manage policies. This includes reviewing 'Last Used', the number of notifications created based on the policy, how many actions and triggers are active, and also elect to pause and/or remove policies:
-
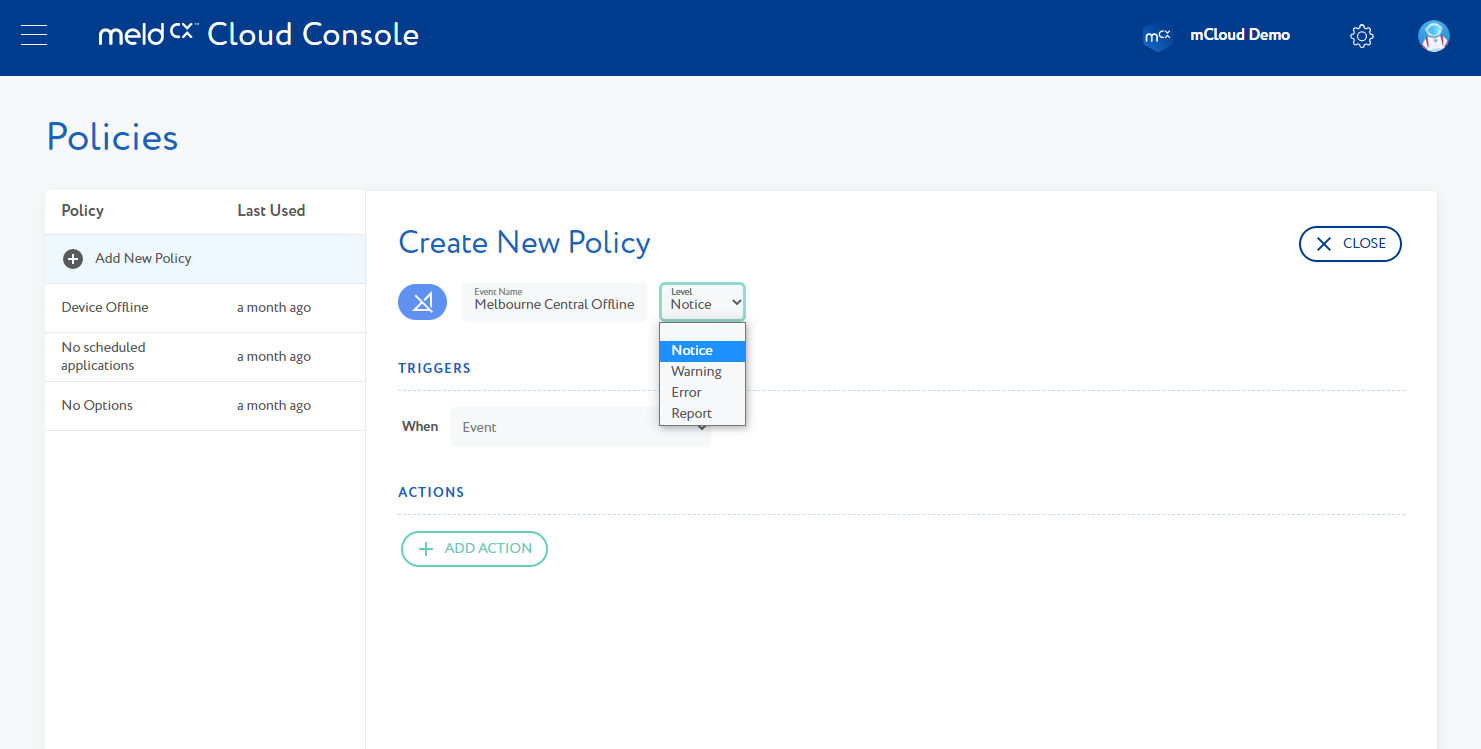
- When creating a policy, you can setup information such as the name of the policy, select an icon, and select the severity level of the policy:
-
- In this initial release we are including 4 events to implement a policy for -
- Device Offline
- Device has no options
- Device has no scheduled apps
- Device Chrome version out of date
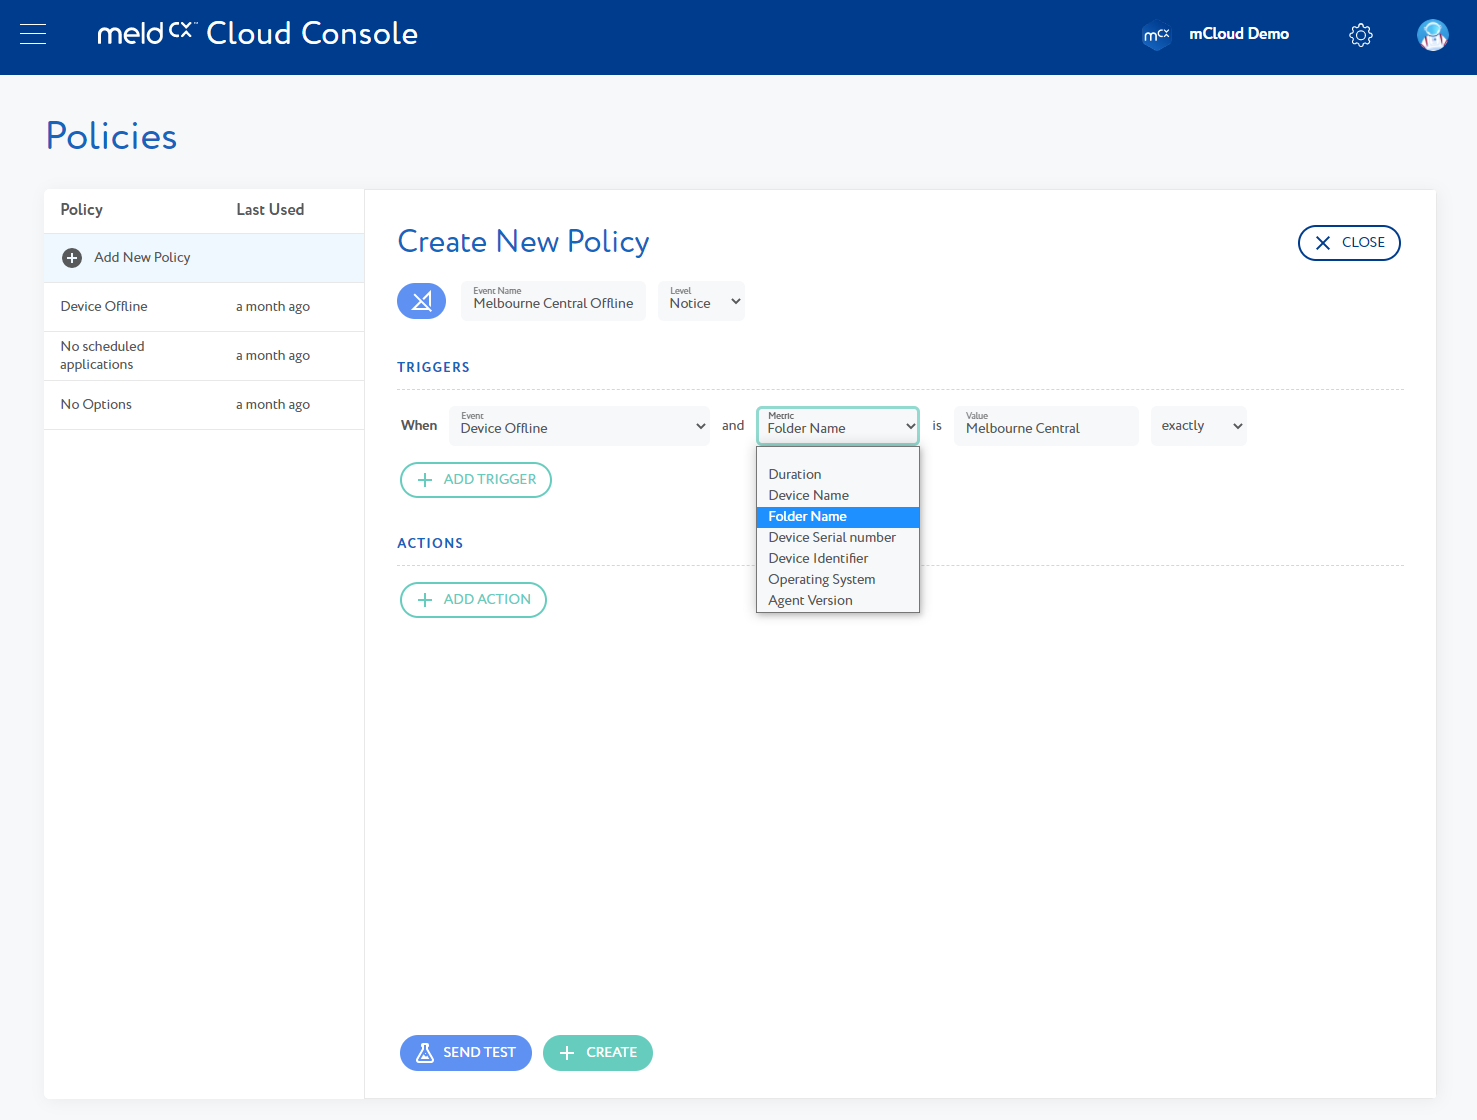
- The above events act as a trigger, coupled with selectable metrics you can see here:
-
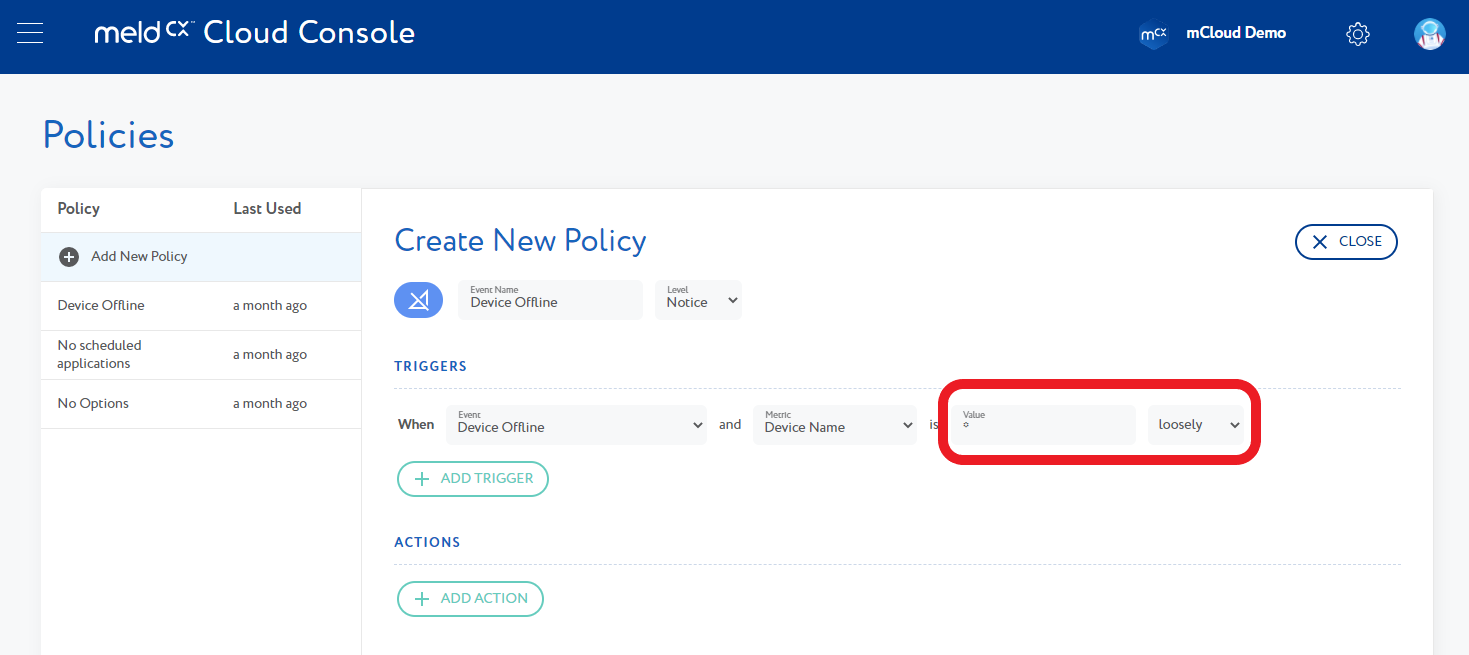
- When entering a Value, you can be as specific as you'd like, or you could add an asterix (*) to include 'all':
-
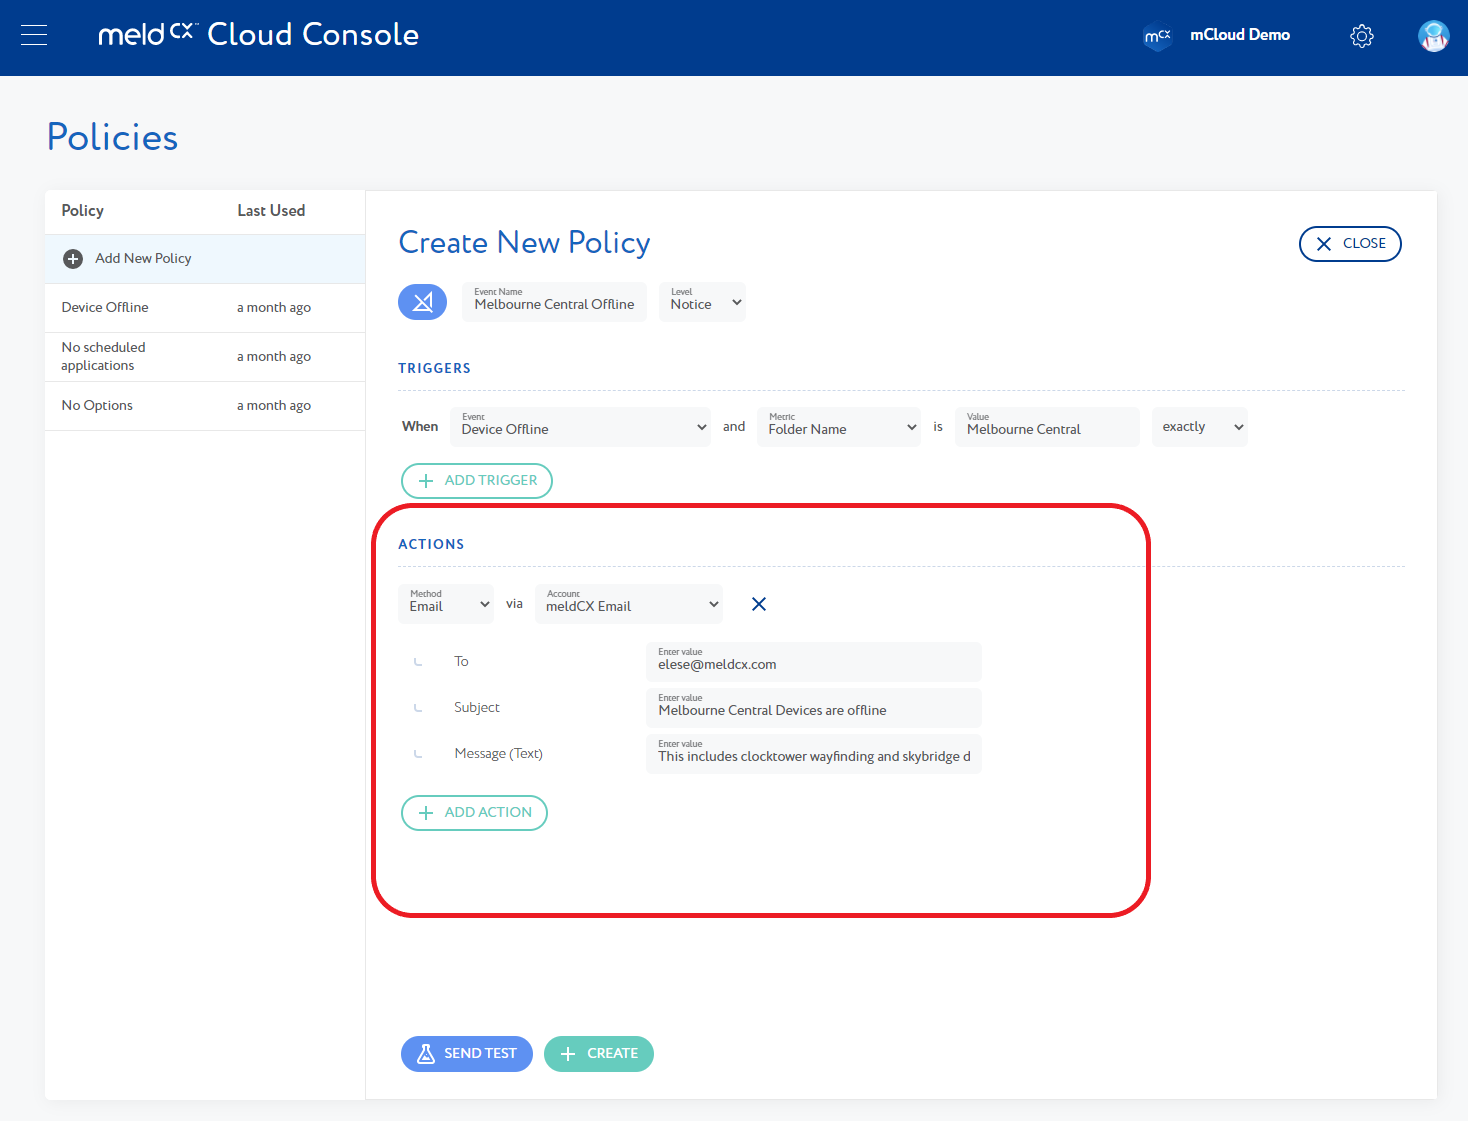
- 'Actions' is where you define what to do once the trigger conditions have been met. You can elect to send your notification utilising any integration you have setup:
-
- Note: If the policy includes multiple devices, any notification that goes out will combine all applicable devices so inboxes or ticketing systems aren’t flooded
Integrations
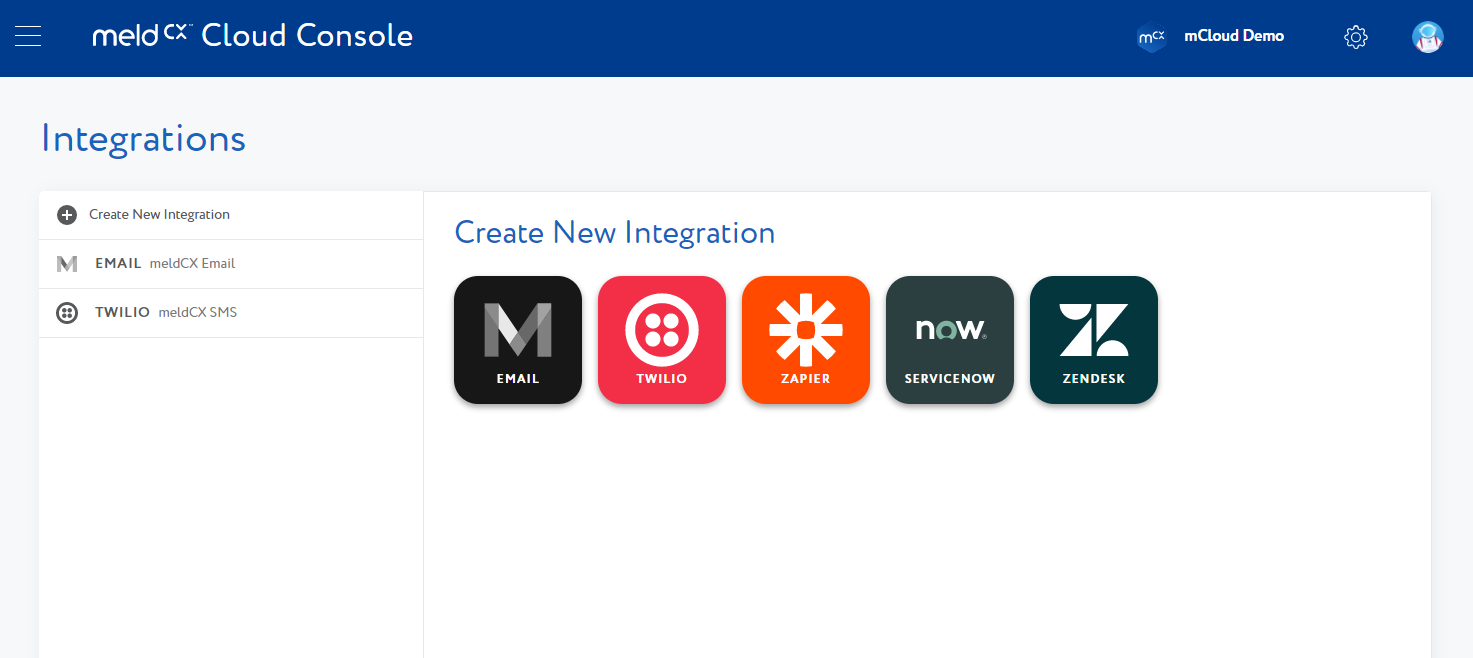
- You can find the Integrations section in the new navigation menu. As you can see, there are a number of services that we have completed integrations with. They are ready for you to link up any of these services you may have active within your organisation:
-
- Email - email integrations are free, you will just need the applicable API Key, a ‘from’ email and a ‘from’ name
- Twilio is applicable for SMS. You will need your own account to link here using an account SID and API key
- Zapier - Zapier is a global automation tool that allows you to integrate almost any web app. You can create your own workflow using Zapier based on triggers and actions. Zapier have over 3,000 apps that can be linked - the list can be found here.
- Service Now - if a you have a Service Now instance, you will need to setup the integration using your instance name, sub domain and instance password
- Zendesk - if a you have Zendesk, you will need to enter the subdomain, API Token and username
- For helpful links to setup your integration, see this article
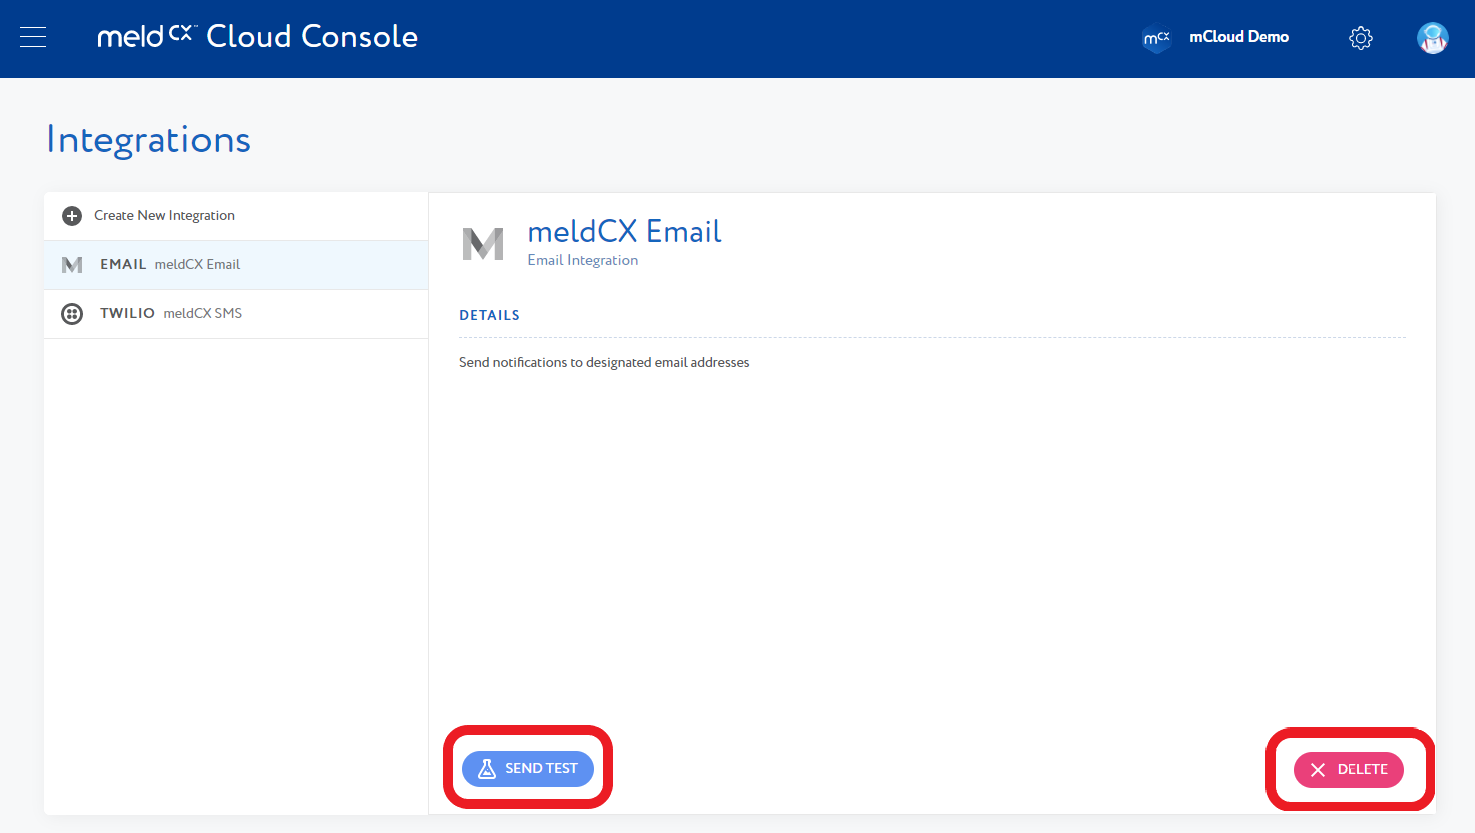
- Once an integration exists, you can then send a test notification. You can also remove an integration:
-
Security
- You can find the Security section in the new navigation menu. The first feature of the Security Centre is 'Audit Trail'
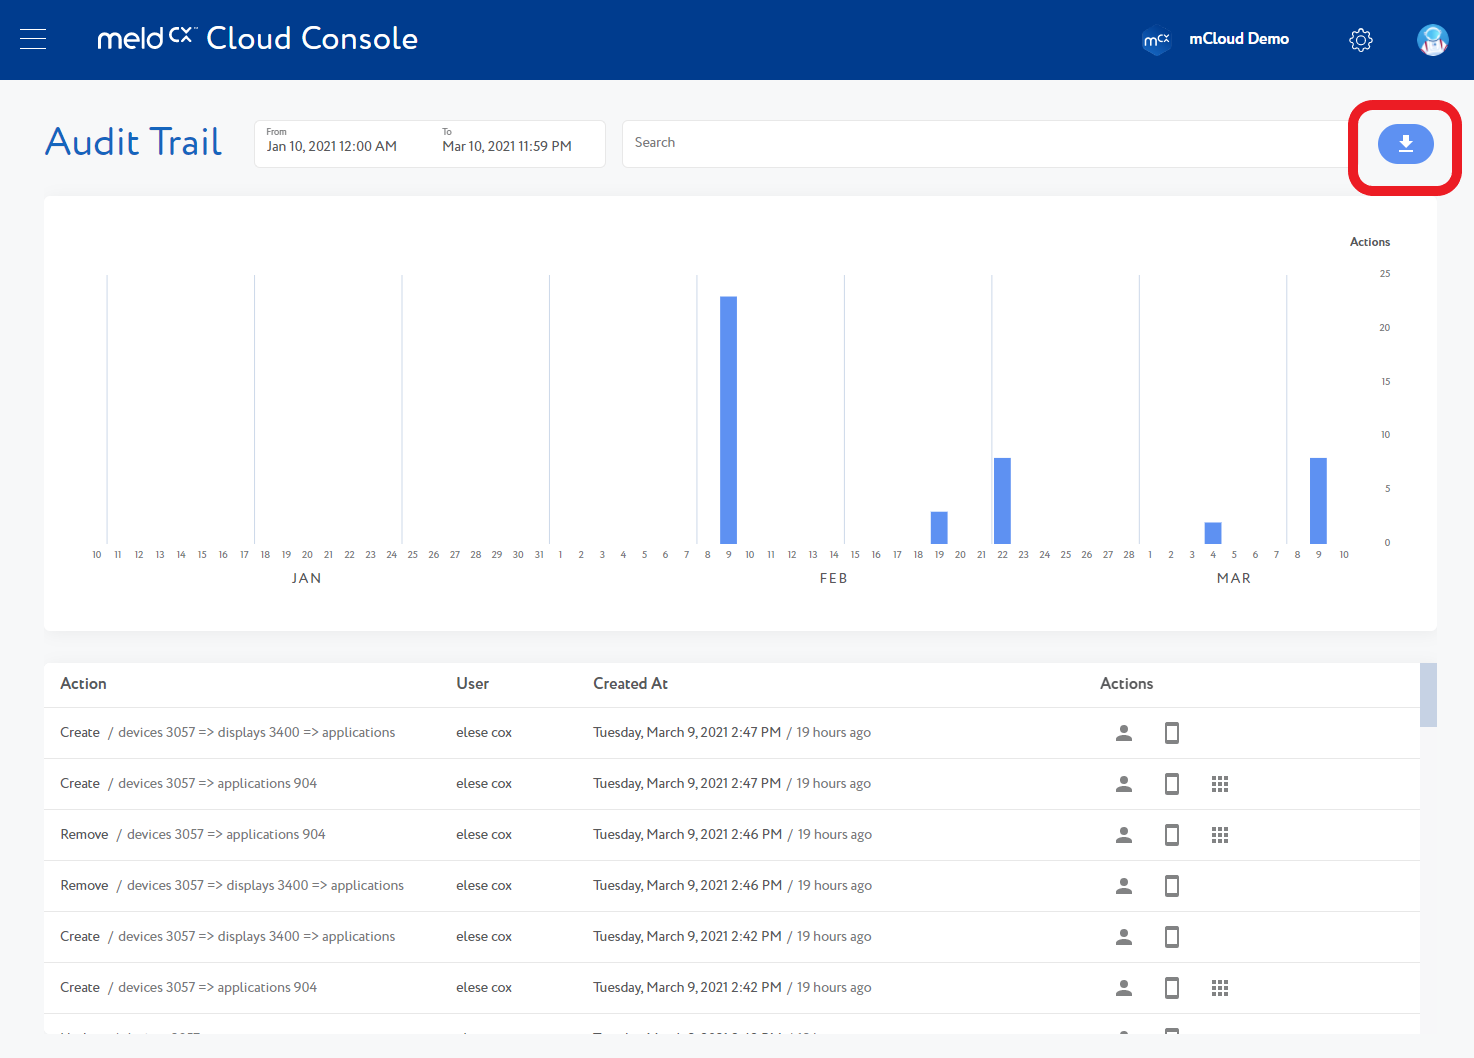
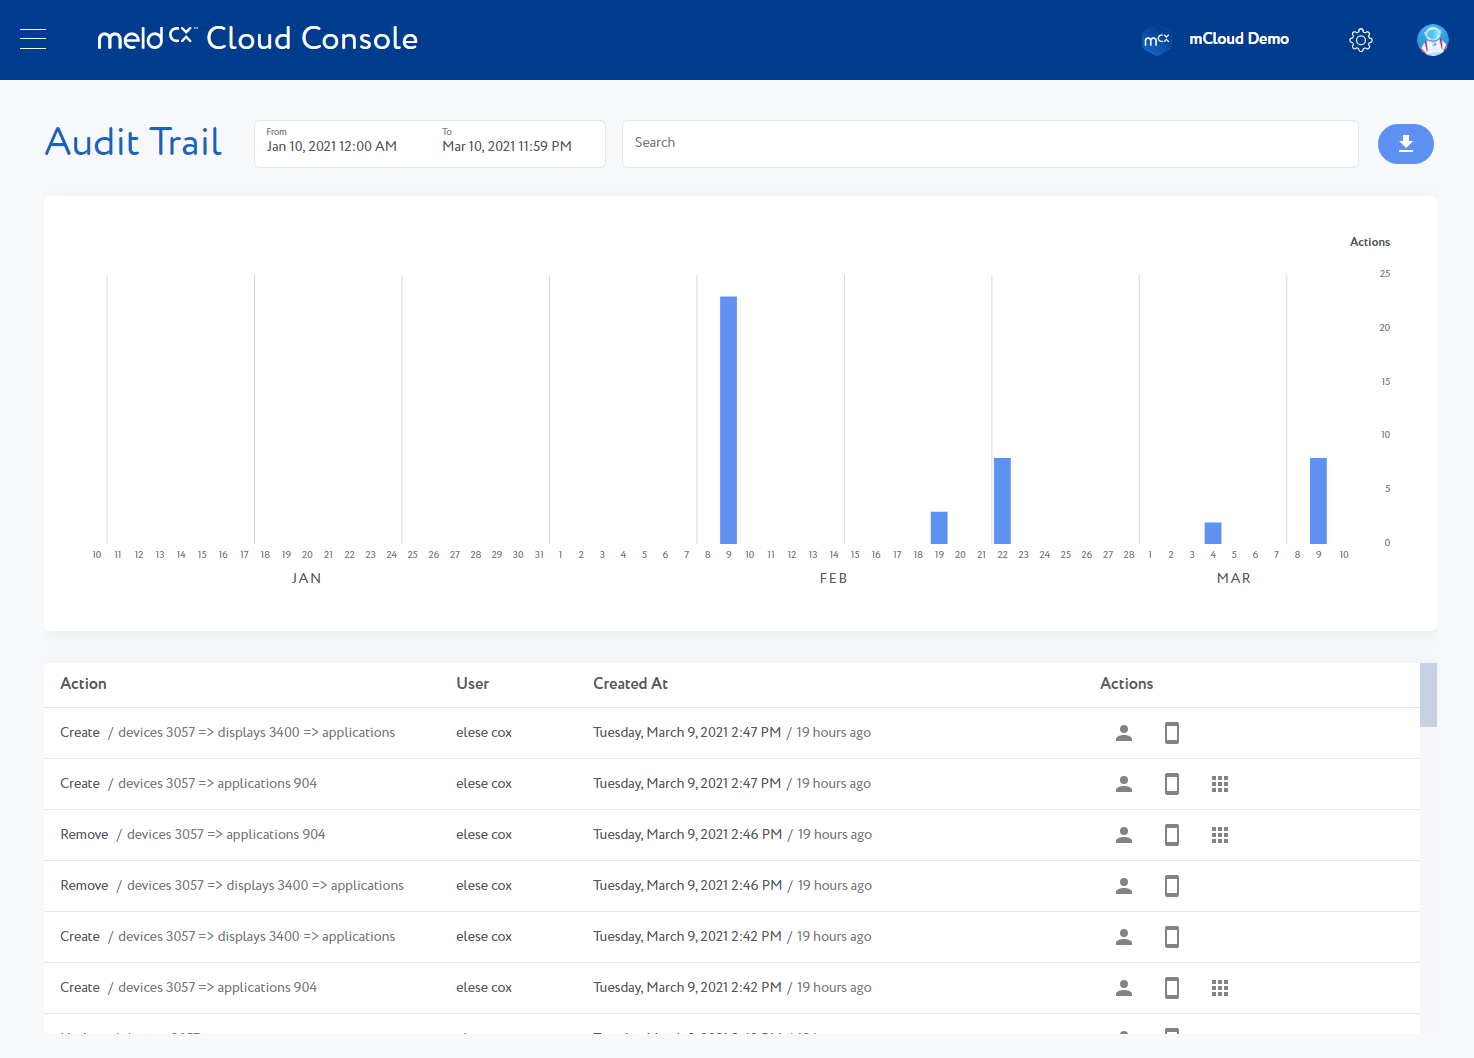
- The Audit Trail feature allows the user to view and investigate what actions are being taken inside of the console. Below you can see a general activity table, showing the number of actions taken over both date and time:
-
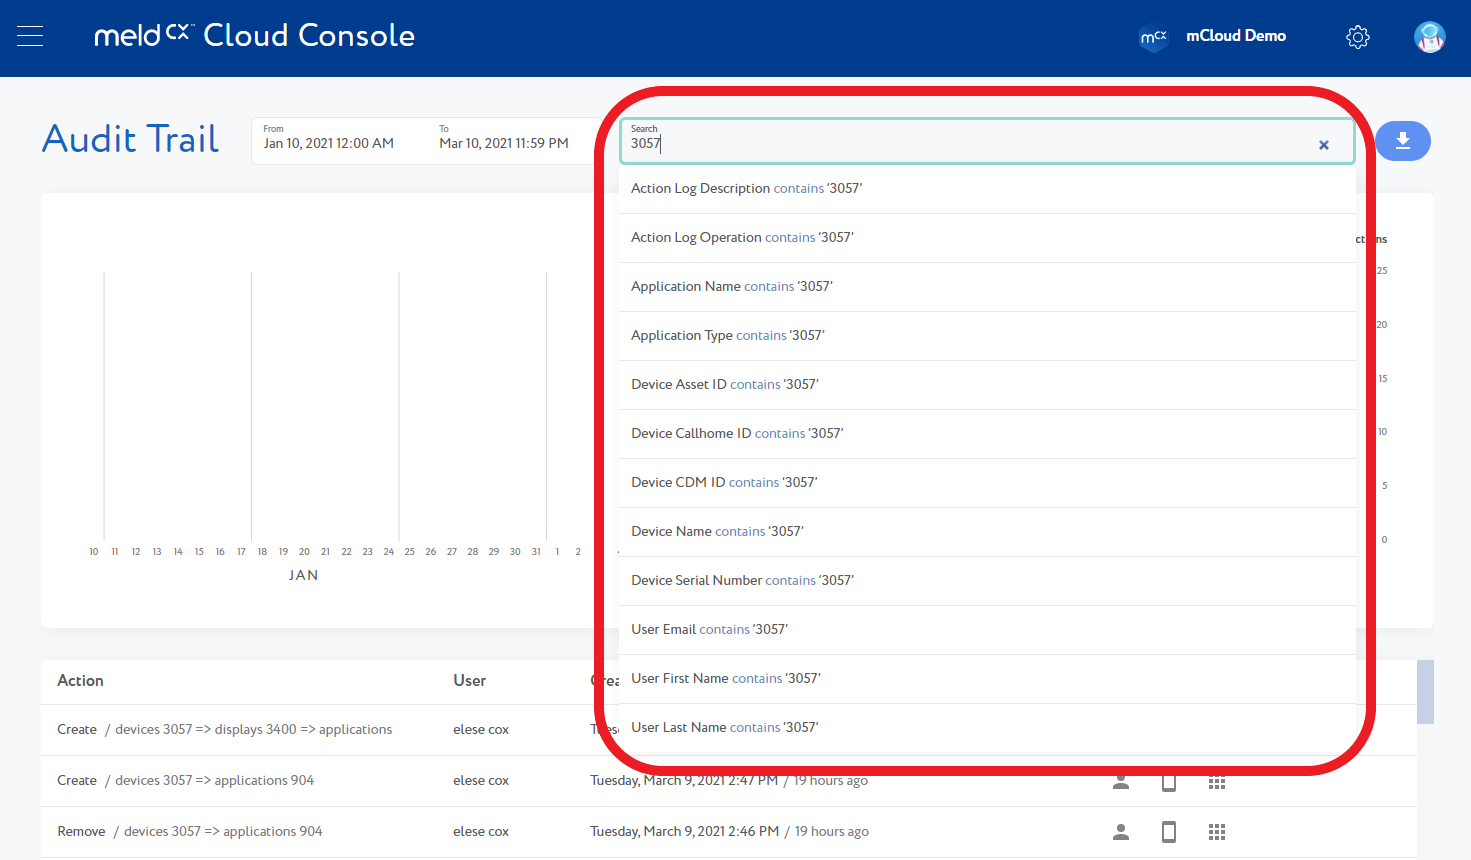
- This includes being able to filter based on date and time, but also a search function - allowing you to search up specific dates/times of incidents where applicable:
-
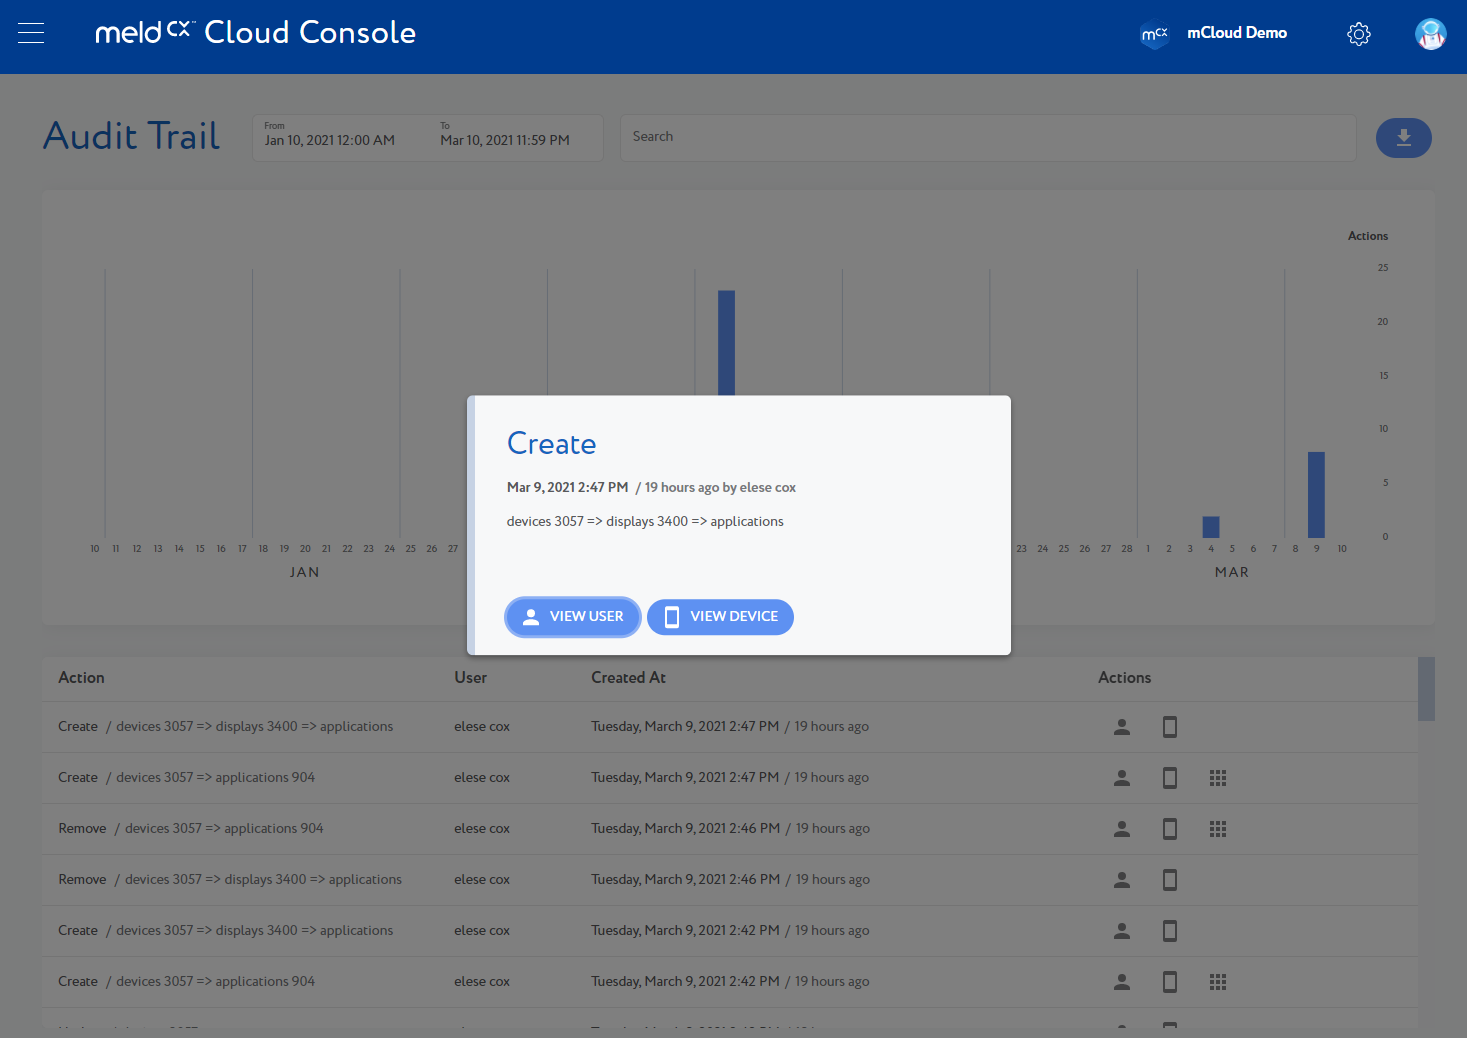
- When you identify an action needing further investigation, you can select the event and dig deeper by either looking at the user, or looking at the device - providing easier access to information and the ability to resolve a potential problem faster:
-
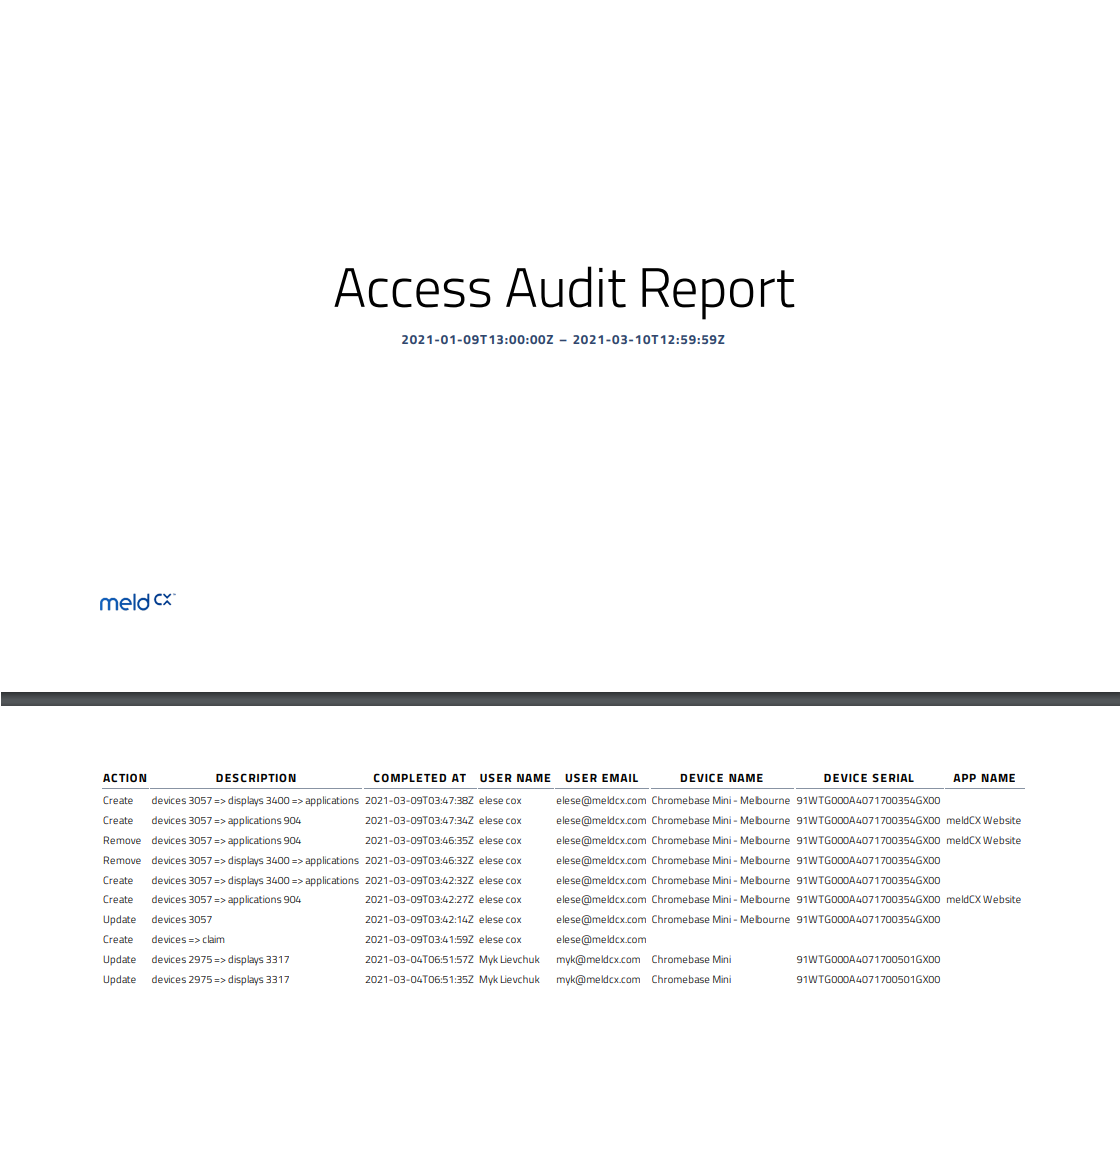
- Any data that can be found and searched here is also downloadable in both csv and pdf formats:
-
- PDF Example:
-

Comments
0 comments
Please sign in to leave a comment.